Demystifying Big Data Analytics: Part-4
Filtering, Grouping, Aggregation, Ordering, Formatting


In this blog post, we will explore how SparkSQL can be used in Java to perform common data operations on financial data. We will focus on five key operations: filtering, grouping, aggregation, date formatting, and ordering. These operations are fundamental in understanding and analyzing financial data, and SparkSQL provides a seamless and intuitive way to achieve them.
In this blog post, we will explore a real-world financial dataset containing information about the quantity, purchase price, purchase date, and stock names. Our goal is to answer the following question:
Question: How can we determine the number of times each stock was purchased and calculate the total purchase quantity for each stock, while also ordering the results by the total quantity in descending order?
Let's take a quick look at the financial data we'll be working with:
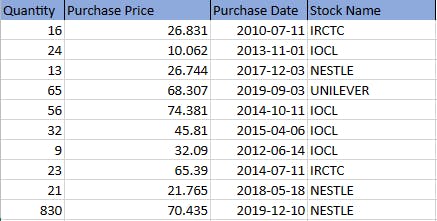
Before directly jumping to answer the question let's understand the operations involved.
Spark SQL Approaches
Now before discussing operations, there are mainly 3 ways of dealing with SparkSQL, let us look at each approach and in a later example with filtering we will look at an example with each of these approaches.
| Method | Description |
| Using Expressions | - Convenient and quick way to write filter conditions using SQL-like syntax. Flexible for complex filter conditions.Not type-safe, potential for runtime errors. Even Database devs can work on it easily. |
| Using Lambdas | - Provides a programmatic approach to filtering. Offers type safety and catch errors during compilation. Well-suited for conditional logic and complex transformations. But may require a deeper understanding of programming concepts and may be more verbose for simple filter conditions. |
| Using Columns | - Strongly typed and statically checked approach. Utilizes the DataFrame's column API with built-in functions. Offers type safety and potential optimizations by Spark's Catalyst optimizer. However, this approach may require more code and familiarity with the DataFrame's column API. |
Filtering
- Method 1: Filter with Expressions
SparkSQL allows us to filter data using expressions, which enables us to specify conditions directly in a SQL-like syntax.
Note: Spark SQL treats column names with spaces as the invalid syntax, hence we require to put the text inside "`text`".
//Filter with expressions
Dataset<Row> filteredDataWithExpressions = df.filter("Quantity > 20 AND `Purchase Price` < 30.0");
- Method 2: Filter with Lambdas
Another approach to filtering in SparkSQL is using Lambdas. With lambdas, we have more flexibility in defining complex filtering conditions.
//Filter with lambdas
Dataset<Row> filteredDataWithLambdas =df.filter((FilterFunction<Row>)
row ->(Long) row.getAs("Quantity") > 20 && (Double) row.getAs("Purchase Price") < 30.0);
- Method 3: Filter using Columns
SparkSQL also provides a convenient way to filter data using columns. By referencing the column names directly, we can easily apply conditions to specific attributes.
//Filter using columns
Dataset<Row> filteredDataWithColumns = df.filter(col("Quantity")
                        .gt(20).and(col("Purchase Price").lt(30.0)));
Grouping
We create a temporary view for the DataFrame using, createOrReplaceTempView() to enable SQL-like operations. Then we use the GROUP BY clause to group the data by the "Stock Name" column and calculate the sum of the "Quantity" column for each group.
 df.createOrReplaceTempView("financial_data"); // Create a temporary view for the DataFrame
 // Grouping
 Dataset<Row> groupedData = spark.sql("SELECT `Stock Name`, SUM(Quantity) as TotalQuantity FROM financial_data GROUP BY `Stock Name`");
Aggregation
We use aggregate functions like AVG() and MAX() to calculate the average and maximum purchase prices from the dataset.
// Aggregation
Dataset<Row> aggregatedData = spark.sql("SELECT AVG(`Purchase Price`) as AveragePrice, MAX(`Purchase Price`) as MaxPrice FROM financial_data");
Date formatting
We use the DATE_FORMAT() function to format the "Purchase Date" column in the desired date format with the desired column name.
// Date formatting
Dataset<Row> formattedData = spark.sql("SELECT `Stock Name`, DATE_FORMAT(`Purchase Date`, 'yyyy-MM-dd') as DateofPurchase FROM financial_data");
Ordering
We use the ORDER BY clause to order the data based on the "Purchase Price" column in descending order.
// Ordering
Dataset<Row> orderedData = spark.sql("SELECT * FROM financial_data ORDER BY `Purchase Price` DESC");
Now that we've explored various operations in SparkSQL, it's time to put your knowledge to the test! Can you try to revisit the question at the beginning and answer it, Don't rush to check the answer.

Hope you have tried, now let's check the answer:
// Grouping and Aggregation: Calculate purchase count and total quantity for each stock and Oder by purchase count
Dataset<Row> stockSummary = spark.sql("SELECT `Stock Name`, COUNT(*) as PurchaseCount, SUM(Quantity) as TotalQuantity FROM financial_data GROUP BY `Stock Name` ORDER BY `PurchaseCount` DESC");
If you need to understand how to set up the workspace and get started with Apache Spark follow my previous blogs listed down:
renjithak.hashnode.dev/demystifying-big-dat..
renjithak.hashnode.dev/demystifying-big-dat..
Reference: spark.apache.org/docs/latest/sql-ref-functi..
Github Repo: github.com/renjitha-blog/apache-spark
See you in the next part, Happy learning :)